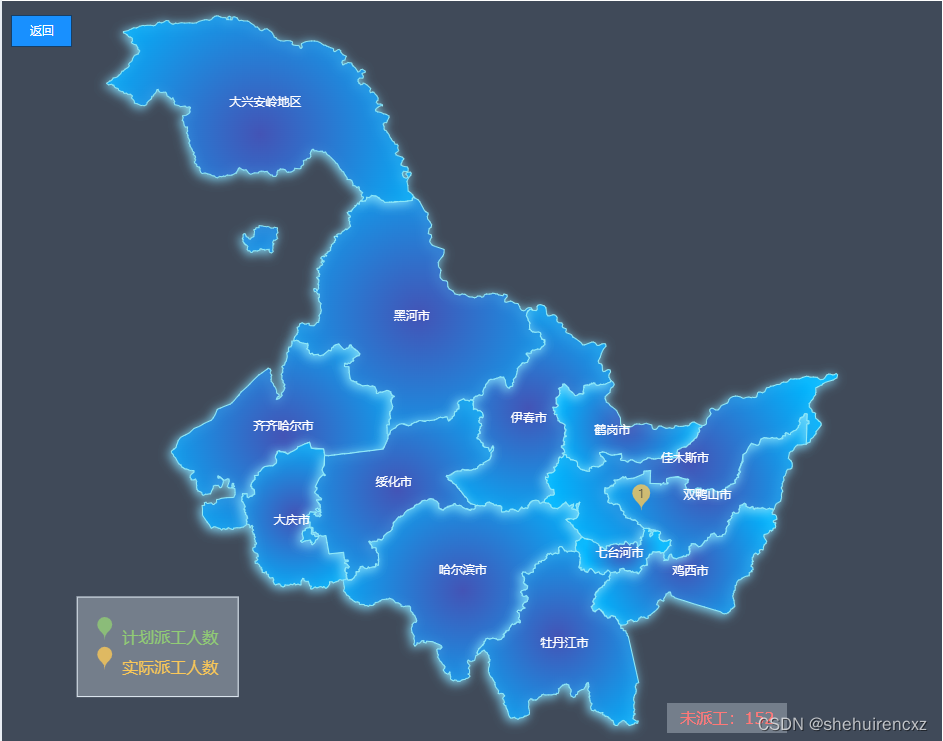
echarts地图下钻与回钻
最近在项目实际业务中为了更清晰的展示各省市的数据,使用echarts实现了地图的下钻和回钻。里面加了实际业务,所以代码有些冗余。

import * as echarts from 'echarts' //echarts引入
import './china'
// 引入省份经纬度
import { geoCoordMap } from './geoMap'
// 引入全国各市经纬度
import { city } from './city'
async initOptions() {
      await getResourceMapInfo(params).then((res) => {
        if (res.code == 0) {
          this.planData = []
          this.reaData = []
          this.show = true
          res.data.forEach((e) => {
            if (e.testRegionList.length > 0) {
              this.regionList.push(e.testRegionList)
            }
          })
          res.data.forEach((item) => {
            if (geoCoordMap[item.testProvince]) {
              //计划派工
              if (item.recordNum !== null) {
                this.planData.push({
                  name: item.testProvince,
                  value: geoCoordMap[item.testProvince].concat(item.recordNum),
                  list: item.recordNumList,
                })
              }
              //实际派工
              if (item.realityNum !== null) {
                this.reaData.push({
                  name: item.testProvince,
                  value: geoCoordMap[item.testProvince].concat(item.realityNum),
                  list: item.realityNumList,
                })
              }
            }
          })
        }
      })
      this.options = {
        // 背景颜色
        backgroundColor: '#404a59',
        // 地图配置
        geo: {
          map: 'china',
          zoom: 1.2,
          roam: false, //支持拖拽缩放
          scaleLimit: {
            //滚轮缩放的极限控制
            min: 1.2, //缩放最小大小
            max: 3, //缩放最大大小
          },
          label: {
            // 通常状态下的样式 (字体)
            normal: {
              show: true,
              textStyle: {
                color: '#fff',
              },
            },
            // 鼠标放上去的样式
            emphasis: {
              textStyle: {
                color: '#fff',
              },
            },
          },
          // 地图区域的样式设置
          itemStyle: {
            normal: {
              borderColor: 'rgba(147, 235, 248, 1)',
              borderWidth: 1,
              areaColor: {
                type: 'radial',
                x: 0.5,
                y: 0.5,
                r: 0.8,
                colorStops: [
                  {
                    offset: 0,
                    color: '#4354b6', // 0% 处的颜色
                  },
                  {
                    offset: 1,
                    color: '#00b6fe', // 100% 处的颜色
                  },
                ],
                globalCoord: false, // 缺省为 false
              },
              shadowColor: 'rgba(128, 217, 248, 1)',
              shadowOffsetX: -2,
              shadowOffsetY: 2,
              shadowBlur: 10,
            },
            // 鼠标放上去高亮的样式
            emphasis: {
              areaColor: '#389BB7',
              borderWidth: 0,
            },
          },
        },
        legend: {
          show: true,
          bottom: '6%',
          left: '8%',
          orient: 'vertical',
          padding: 20,
          backgroundColor: 'rgba(236,246,255,0.30)',
          borderWidth: 1,
          borderColor: '#e9f3fb',
          itemGap: 0,
          itemWidth: 25,
          itemHeight: 25,
          symbolKeepAspect: false,
          inactiveColor: '#999999',
          textStyle: {
            fontSize: 16,
            color: '#',
          },
          data: [
            {
              name: '计划派工人数',
              icon: 'pin',
            },
            {
              name: '实际派工人数',
              icon: 'pin',
            },
          ],
        },
        // 数值
        series: [
          {
            type: 'map',
            name: 'map',
            aspectScale: 0.75,
            layoutCenter: ['50%', '50%'], //地图位置
            layoutSize: '125%',
            roam: true,
            geoIndex: 0,
            label: {
              show: false,
            },
            showLegendSymbol: false,
          },
          {
            name: '计划派工人数',
            type: 'scatter',
            coordinateSystem: 'geo',
            data: this.planData,
            symbol: 'pin',
            symbolSize: [30, 30],
            symbolOffset: [-5, -5],
            label: {
              show: true,
              position: 'inside',
              color: '#333',
              formatter: function (params) {
                return params.value[2]
              },
            },
          },
          {
            name: '实际派工人数',
            type: 'scatter',
            coordinateSystem: 'geo',
            data: this.reaData,
            symbol: 'pin',
            symbolSize: [30, 30],
            symbolOffset: [10, 10],
            label: {
              show: true,
              position: 'inside',
              color: '#333',
              formatter: function (params) {
                return params.value[2]
              },
            },
          },
        ],
      }
      if (this.charts) {
        this.charts.setOption(this.options)
      }
      this.allCoutryPlanData = this.planData
      this.allCoutryReaData = this.reaData
    },
    drawChart() {
      this.charts = echarts.init(document.getElementById('china'))
      this.charts.setOption(this.options)
      // 鼠标单击地图取消高亮效果
      this.charts.on('click', async (params) => {
        console.log(params)
        if (params.componentSubType == 'scatter') {
          this.changeTable = true
          console.log(11111)
          this.data = params.data.list
          this.data = mprowTable(this.data, 'testRegion')
          this.province = params.name
          this.peopleDesc = params.seriesName
          this.peopleNum = params.value[2]
          if (params.seriesName == '实际派工人数') {
            this.typeNum = 2
            this.columns[4].title = '实际进场时间'
            this.columns[5].title = '实际离场时间'
          } else {
            this.typeNum = 1
            this.columns[4].title = '计划进场时间'
            this.columns[5].title = '计划离场时间'
          }
        }
        await this.charts.dispatchAction({
          type: 'unselect',
          name: params.name,
        })
        if (params.componentSubType == 'map') {
          console.log(this.regionList, 'regionList')
          this.selectRegion = []
          let index = this.regionList.findIndex((item) => item[0].testProvince == params.name)
          this.selectRegion = this.regionList[index]
          this.goDown(params.name)
        }
      })
    },
    async getMapJson(name) {
      const jsonData = await import('./json/' + name + '.json')
      return jsonData.default
    },
    // 地图下钻
    async goDown(name) {
      if (this.currentLevel != 2) {
        const mapname = name
        if (!echarts.getMap(name)) {
          const newMapJson = await this.getMapJson(name)
          echarts.registerMap(mapname, newMapJson)
        }
        this.options.geo.map = mapname
        this.options.series[0].map = mapname
        //然后重新绘制地图
        this.currentName = name
        this.history.push(this.currentName)
        //获取地图数据之后,修改地图options
        //需要改data
        console.log(this.selectRegion, 'this.selectRegion')
        this.options.series[1].data = []
        this.options.series[2].data = []
        if (this.selectRegion !== undefined) {
          this.planData = []
          this.reaData = []
          this.selectRegion.forEach((item) => {
            //计划派工
            if (item.recordNum !== null && item.recordNum !== 0) {
              console.log(11111)
              this.planData.push({
                name: item.testRegion,
                value: city[item.testRegion].concat(item.recordNum),
                list: item.recordNumList,
              })
            }
            //实际派工
            if (item.realityNum !== null && item.realityNum !== 0) {
              console.log(2222222)
              this.reaData.push({
                name: item.testRegion,
                value: city[item.testRegion].concat(item.realityNum),
                list: item.realityNumList,
              })
            }
          })
          this.options.series[1].data = this.planData
          this.options.series[2].data = this.reaData
        }
        console.log(this.options)
        this.charts.setOption(this.options)
        this.currentLevel += 1
        this.data = []
        this.province = ''
      }
    },
    // 地图回钻
    returnUpLevel() {
      //先判断history有没有数据,能不能返回
      if (this.history.length == 0) {
        return false
      }
      //取出要返回的那个名字
      const name = this.history.pop()
      const mapname = 'china'
      // const currentJson = this.echarts.getMap(mapname).geoJson
      //修改地图配置重新绘制地图
      this.options.geo.map = mapname
      this.options.series[0].map = mapname
      //修改data
      this.options.series[1].data = this.allCoutryPlanData
      this.options.series[2].data = this.allCoutryReaData
      this.charts.setOption(this.options)
      //修改当前的层级,名字
      this.currentName = name
      this.currentLevel -= 1
      this.data = []
      this.province = ''
    },
版权声明:本文为shehuirencxz原创文章,遵循 CC 4.0 BY-SA 版权协议,转载请附上原文出处链接和本声明。